
1. Introduction
SEISVIEW is an interactive seismic data file viewer for the Lynx Exploration Archivist system.
Supported formats include SEG-Y, SEG-Y Revision 1, and Lynx Trace File (TR) format.
SEISVIEW also provides a command-line utility for generating seismic image plots.
Features
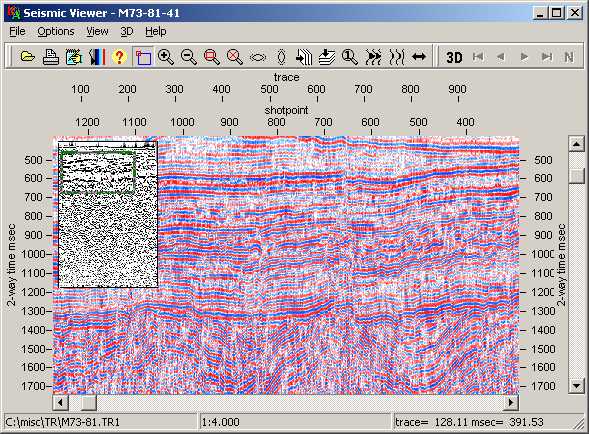
- central display area for showing seismic data in a variety of formats at almost any scale. The display format and scale are controlled by the main menu or tool bar options
- the overview shows a thumbnail of the whole input file, with a moveable rectangle indicating the area viewed in the main display
- tool bar enables quick access to all the viewer functions
- the main menu and sub menus duplicate the tool bar functions
- display parameters can be stored and re-used
- context sensitive help
- scroll bars for positioning the main display
- two horizontal scale bars, selected from trace, shotpoint, CDP or distance
- two vertical scale bars, selected from seconds, msec or samples
- status bar showing input file, cursor position and selected option
2. Running SEISVIEW
A seismic file can be opened for viewing in three ways:
- Select the File-Open menu option, and select the file in the open file dialogue
- Specify the file on the command line when starting SEISVIEW
- Drag the file from an explorer window, and drop it on SEISVIEW
SEISVIEW can conveniently be started by double clicking its icon in Launcher, or from a command line or script.
2.1 Windows - Command-line options
The Windows 32bit GUI executable file is SEISVIEW.EXE.
SEISVIEW can be run with a command line similar to the following:
SEISVIEW [TRACEFILE]
where:
TRACEFILE is an optional seismic data file. If no TRACEFILE is
specified, you can select one from the dialogue box which appears when you click the
File-Open menu or tool bar button.
SEISVIEW requires a licence activation file from Lynx. If no activation file is found, SEISVIEW will run in evaluation mode, and display a splash screen on startup - to remove this splash screen, please purchase a licence.
.2.2 Console - Command-line options
SEISVIEW can be used at the command prompt and in batch files to generate seismic image plots.
The Windows 32bit console mode executable file is SEISVIEWCONSOLE.EXE.
Command line syntax is as follows:
SEISVIEWCONSOLE TRACEFILE OPTIONS
where:
| TRACEFILE | is a seismic data file in SEGY or Lynx Trace File format |
| OPTIONS include the following: | |
| One of the following 3 parameters is required | |
| -jpeg=[path] | file path for JPEG image output file. Generate a single image or image tile. |
| or | |
| -jpegTileDir=[path] | folder path for JPEG image output folder. Generates all image tiles at specified scale/style/zoom level. Tiles are numbered from 1 in the top left corner, increasing left-to-right, top-to-bottom. -tileSize and -totalSize parameters (below) also required. |
| or | |
| -ccards=[path] | file path for output text file containing C-Cards from TRACEFILE. This file will be overwritten without warning if it already exists. |
| -paramfile=[path] | path to SEISVIEW display parameters file (copy from your user profile AppData\Roaming\LynxData\CUSTOM folder) |
| -printinfo=[path] | path to ASCII text file - this text will be added to JPEG output |
| -intersections=[path] | path to XML intersections file (generated by Seismap) - intersections plotted in shotpoint scalebar |
| -quality=[number] | JPEG output image quality: 1=max compression, 100=no compression |
| -displaystyle=[number] | seismic image display style:
|
| -ampl=[number] | trace amplitude level as percentage - 100=normal, <100=decrease amplitude, >100=increase amplitude |
| -horizscale=[number] | denominator of nominal horizontal scale - eg 25000 |
| -vertscale=[number] | vertical scale in cm/s |
| -noborders | no plot margins or line name text - used for generating image tiles |
| -dirltor=[number] | Set the trace plotting direction as left-to-right (1) or right-to-left (0). |
| -traces=[first,last] | first and last trace numbers to plot (1-based index) - used for generating image tiles |
| -samples=[first,last] | first and last sample numbers to plot (1-based index) - used for generating image tiles |
| -zoom=[number] | zoom level as percentage - 100=normal, <100=zoomed out, >100=zoomed in |
| -overwrite | Overwrite existing image tiles in jpegTileDir folder. Optional. If omitted, existing JPEG files will not be overwritten. |
| The following parameters are required with -jpegTileDir | |
| -numTiles=[x,y] | Number of tiles in X and Y direction |
| -tileSize=[x,y] | Size of each tile, in pixels. |
| -totalSize=[x,y] | Total image size in pixels (using current horiz/vert scale and zoom level) |
| -3d=[number] | Display as 3D inlines: 0=NO, 1=YES. See Seismic 3D Inline Display |
| -3dindex=[path] | Path to Lynx 3DINDEX inline index file. Required when displaying an inline from a 3D seismic volume. |
| -3dformat=[number] | Format of SEGY file: 0=Standard SEGY, 1=SEGY Revision 1. Required if -3d=1 and -3dindex not specified. |
| -3dheaders=[i,j] | Trace header byte numbers (1-based) for inline (i) and crossline (j). Required with -3dindexcreate flag or if -3dformat=0. |
| -3dpad=[number] | Pad all inlines to maximum inline length for plot: 0=NO, 1=YES. Required with -3dindexcreate flag |
| -3dinline=[number] | Inline index number (1-based) to plot. |
| -3dindexcreate=[path] | Create Lynx 3DINDEX inline index file and exit. Requires -3dformat, -3dheaders (if -3dformat=0), -3dpad |
| -version | Print version information to standard output and exit. |
Examples of SEISVIEWCONSOLE command-lines for generating image tiles might look like this:
SeisviewConsole.exe c:\temp\118.stk -jpeg=C:\temp\118-greyinterp-tile1.jpg -noborders -traces=1,100 -samples=1,200 -displaystyle=6 -zoom=200
SeisviewConsole.exe c:\temp\118.stk -jpeg=C:\temp\118-greyinterp-tile2.jpg -noborders -traces=1,100 -samples=201,400 -displaystyle=6 -zoom=200
SeisviewConsole.exe c:\temp\118.stk -jpeg=C:\temp\118-greyinterp-tile3.jpg -noborders -traces=101,200 -samples=1,200 -displaystyle=6 -zoom=200
SeisviewConsole.exe c:\temp\118.stk -jpeg=C:\temp\118-greyinterp-tile4.jpg -noborders -traces=101,200 -samples=201,400 -displaystyle=6 -zoom=200
SEISVIEWCONSOLE requires a licence activation file from Lynx. If no activation file is found, SEISVIEWCONSOLE will exit immediately.
SEISVIEWCONSOLE operates silently. No status updates are written to standard output in normal operation. By default, all command lines are logged in the file SEISVIEWCONSOLE.LOG in your user profile %APPDATA%\LynxData folder. This log file also records error messages. Logging is can be controlled by editing a parameter in SEISVIEW.INI [startup] section: set console log=0 to turn logging off, or set console log=1 to turn logging on.
3. Menus and Controls
- File
- Open

Select an input file via a standard Windows Open Dialogue - File Attributes
Displays LEA Seismic Object attributes for the currently open file (if the LEA Seismic Object is installed and registered). - Print

Print a screen snapshot or the full image. for more details see Viewer Common Functionality - Print
- Open
- Options
- Edit Parameters

Displays a PRMEDIT window to edit the display parameters. See Parameters below for details. - Show Options

Displays a popup menu for quick access to the trace display mode. The display mode can also be set in the display parameters.- VA Variable area only
- Wiggle Wiggle trace only
- VA/Wiggle Varible area with wiggle trace overlay
- Greyscale Sample Greyscale black (high amplitude) to white (low amplitude) variable density sample display
- Blue-White-Red Sample Blue (high amplitude) to white to red (low amplitude) sample display
- Blue-White-Red Sample/Wiggle Blue to white to red colour sample display with wiggle trace overlay
- Greyscale Interpolated Greyscale black (high amplitude) to white (low amplitude) variable density subsampled to individual pixels
- Blue-White-Red Interpolated Blue (high amplitude) to white to red (low amplitude) display sub-sampled to individual pixels
- Orange-White-Black Interpolated Orange (high amplitude) to white to black (low amplitude) display sub-sampled to individual pixels
- Green-White-Brown Interpolated Green (high amplitude) to white to brown (low amplitude) display sub-sampled to individual pixels
- Show Colour Bar displays the colour bar for the current display mode
- Revert to Defaults
Remove all user customisations and return to the system-defined display parameter defaults. Any modications you have made to the display parameters will be lost.
- Edit Parameters
- View
The standard view manipulation functions on this menu are described in Viewer Common Functionality - 3D
See Seismic 3D Inline Display for a description of this menu.
4. Display Parameters
SEISVIEW parameters control the characteristics of the screen display for the seismic traces. Parameters are edited through the standard PRMEDIT LEA component and stored in a standard LEA type parameter file seisview.svw in your user-custom folder
- 4.1 Trace Display Parameter Page
- 4.2 General Options Parameter Page
- 4.3 Shotpoint Source Parameter Page
- 4.4 Grid Options Parameter Page
4.1 Trace Display Parameter Page
Display style - select the trace display type from the following options:
- VA Variable area only
- Wiggle Wiggle trace only
- VA/Wiggle Varible area with wiggle trace overlay
- Greyscale Sample Greyscale black (high amplitude) to white (low amplitude) variable density sample display
- Blue-White-Red Sample Blue (high amplitude) to white to red (low amplitude) sample display.
- Blue-White-Red Sample/Wiggle Blue to white to red colour sample display with wiggle trace overlay
- Greyscale Interpolated Greyscale black (high amplitude) to white (low amplitude) variable density subsampled to individual pixels
- Blue-White-Red Interpolated Blue (high amplitude) to white to red (low amplitude) display sub-sampled to individual pixels
- Orange-White-Black Interpolated Orange (high amplitude) to white to black (low amplitude) display sub-sampled to individual pixels
- Green-White-Brown Interpolated Green (high amplitude) to white to brown (low amplitude) display sub-sampled to individual pixels
See also the Options - Show Options menu.
Horizontal Scale - the approximate horizontal trace scale, eg 1:25000 will give a 1mm trace spacing if the input trace file has a CDP spacing of 25m. For Lynx Trace files and Lynx-variant SEGY files, the trace spacing stored in the binary header will be used to calculated the trace spacing from the horizontal scale set here. For SEG-Y files where the trace spacing is unknown, a default value of 25m is assumed. This horizontal scale will be used for generated full-scale plots and JPEG output.
Vertical Scale - the approximate vertical scale on the screen, and for full-scale plots (and JPEG output) in the units defined below.
Vertical Scale Units - select the units for the vertical scale: either centimetres per second or inches per second.
Amplitude Factor - the amplitude factor f is calculated relative to RMS, the root mean square amplitude for the input data traces. The display amplitude is adjusted so that RMS = 3 x trace spacing and then multiplied by f. Setting f = 1.0 should give a reasonable looking VA/Wiggle display. Colour and greyscale displays are such that 3 x RMS is equal to the maximum range of the palette. Setting f to greater than 1.0 will increase the saturation and may cause clipping. Why three times? - because the peak-to-peak amplitude of normally distributed samples will be approx 2 root 2, or 2.828 times the RMS. That's near enough 3, to geophysical accuracy.
Amplitude Scale - select from:
- Auto - the RMS amplitude of the input data will be calculated and used in the amplitude factor calculation above. Most of the time, this will work quite well.
- Fixed - a fixed input amplitude will used to scale the data. This amplitude shoud be entered below.
Peak Amplitude - enter the amplitude value to correspond with one trace spacing (VA or Wiggle displays), or to the maximum range of the palette (greyscale or colour display)
Trace Clip Amplitude - for wiggle-trace display modes, the maximum allowed deflection of a trace from its zero line, measured in trace spacings. Amplitudes larger than this will be clipped ie set to this value.
Plot direction - controls the horizontal orientation of the display:
- LtoR - plot the traces from the seismic file from left to right
- RtoL - plot the traces from right to left
4.2 General Options Parameter Page
Display Overview at startup - Yes/No
Set to "Yes" to
ensure that the overview is visible on startup
Upper trace scale - select from:
- None - no upper trace scale will be displayed
- Trace - sequential trace numbers, starting at 1
- CDP - sequential CDP numbers for 2D seismic profiles. For Lynx Trace Files and Lynx-variant SEG-Y files, the first CDP value are read from the binary header. For 3D seismic data see Seismic 3D Inline Display.
- Shotpoint - see the Shotpoint Source page below
- Distance - cumulative distance along the profile, using the nominal trace separation read from the binary file header (for Lynx Trace Files and Lynx-variant SEG-Y only).
Set the type of scale used for the upper scale bar, above the trace display. The scale-type chosen here will also be used to show the current X-mouse-position in the status bar when the mouse is moved over the viewer window.
Upper trace scale Units - select the units for the upper trace scale (only activated when the upper trace scale is distance)
Lower trace scale - select from:
- None - no upper trace scale will be displayed
- Trace - sequential trace numbers, starting at 1
- CDP - sequential CDP numbers for 2D seismic profiles. For Lynx Trace Files and Lynx-variant SEG-Y files, the first CDP value are read from the binary header. For 3D seismic data see Seismic 3D Inline Display.
- Shotpoint - see the Shotpoint Source page below
- Distance - cumulative distance along the profile, using the nominal trace separation read from the binary file header (for Lynx Trace Files and Lynx-variant SEG-Y only).
Set the type of scale used for the lower scale bar, above the trace display
For shotpoint scales, see the Shotpoint Source parameter page.
Lower trace scale Units - select the distance units for the lower trace scale (only activated when the lower trace scale type is distance)
Left scale units - select from
Select from: msecs, microsecs, secs, samples)
Type of scale used for the vertical left time scale bar. The scale-type chosen here will also be used to
show the current Y mouse-position in the status bar when the mouse is moved over the viewer window.
Right scale units
Select from: msecs, microsecs, secs, samples
Type of scale used for the vertical right time scale bar
4.3 Shotpoint Source Parameter Page
This parameter page is displayed when you select 'Shotpoints' for either the upper or lower trace scales (above). Use this page to specify how shotpoint information for 2D seismic lines is read from the current seismic data file.
Shotpoint Source - select from:
- Calculated - use the first shotpoint and shotpoint increment read from the binary file header of Lynx Trace Files and Lynx-variant SEG-Y files. This is the fastest and most reliable way of displaying shotpoint information. For standard SEG-Y files these values are not present in the binary header, so default values will be used, and the displayed shotpoints will revert to trace numbers.
- Trace Headers - shotpoint values will be read from the headers of individual traces as required. This may slow down the display considerably, but allows irregular/discontinuous shotpoint sequences to be displayed. Shotpoint values are usually stored as integers in SEG-Y trace headers (due to limitations in the SEG-Y standard), so this may result in duplicate shotpoint values.
SP Header Configuration - when the shotpoint source is Trace Headers, select the configuration to use to read shotpoint values:
- Lynx TR - read auxiliary shotpoint values from trace headers for Lynx Trace Files. This option has undefined behaviour for SEG-Y files.
- SEGY Standard & REV1 - read shotpoint values from the standard trace header
locations for standard SEG-Y files and SEG-Y Revision 1 files. This option has undefined behaviour
for Lynx Trace Files.
For Standard SEG-Y files, the shotpoint value for each trace is stored as an integer in bytes 17-20. This may result in adjacent traces storing the same shotpoint value (due to rounding). SEG-Y Revision 1 defines new header slots for shotpoint storage, to work around this problem of duplicated shotpoint values in standard SEG-Y; for SEG-Y Revision 1, shotpoint values are stored as an integer in bytes 197-200, with a shotpoint scalar value stored in bytes 201-202, allowing non-integer shotpoint values to be stored for each trace. - Custom SEGY - read shotpoint values from a user-defined trace header slot, using the options below. This option is not yet implemented.
SP Value Hdr Byte Offset - 1-based byte offset for each trace header - default 17.
SP Format - select from Integer, Floating Point
Integer Type - 2-byte, 2-byte Rev, 4-byte, 4-byte Rev
Float Type - IEEE, IEEE Rev, IBM, IBM Rev
SP Value Scalar - None, Constant, Header
SP Scalar Constant - default 0
SP Scalar Hdr Byte Offset - default 201
SP Scalar Integer Type - 2-byte, 2-byte Rev, 4-byte, 4-byte Rev
4.4 Grid Options Parameter Page
Show timing lines - Yes/No - turn on or off the display of horizontal time lines over the seismic display. Timing lines can be useful when generating plots, but are less useful for on-screen display, as the cursor position is displayed in the status bar underneath the seismic display.
Timing line interval, msec - set the interval for timing lines - default 1000.
Show trace lines - Yes/No - turn on or off the display of vertical trace lines over the seismic display.
Trace line interval, traces - set the interval for trace lines - default 100.
Line colour - select the colour for timing lines and trace lines - default Black.
Changes you make here will be saved as your user-default display properties for SEISVIEW, and used each time SEISVIEW is opened. You can discard all your changes and reset to the system default display properties using the Options-Revert to Defaults menu option.
5. Startup Configuration
Like all Lynx Exploration Archivist application programs, SEISVIEW has a corresponding INI file in the Lynx system directory where it was installed, or optionally in the user's CUSTOM directory.
The [STARTUP] section of SEISVIEW.INI file contains program constants which are applied as the program starts up.To alter startup behaviour, these can be edited either manually in a text editor such as Notepad , or through the LEACfg utility.
width=www determines SEISVIEW's width, www in pixels at startup.
height=hhh determines SESIVIEW's height, hhh in pixels, at startup
overview size=sss determines the initial width sss of the overview window in pixels. The height is scaled to reflect the aspect ratio of the section.
6. Error Messages
Input file format error - the input file format could not be opened - the format could not be recognised, or data could not be read from the file.